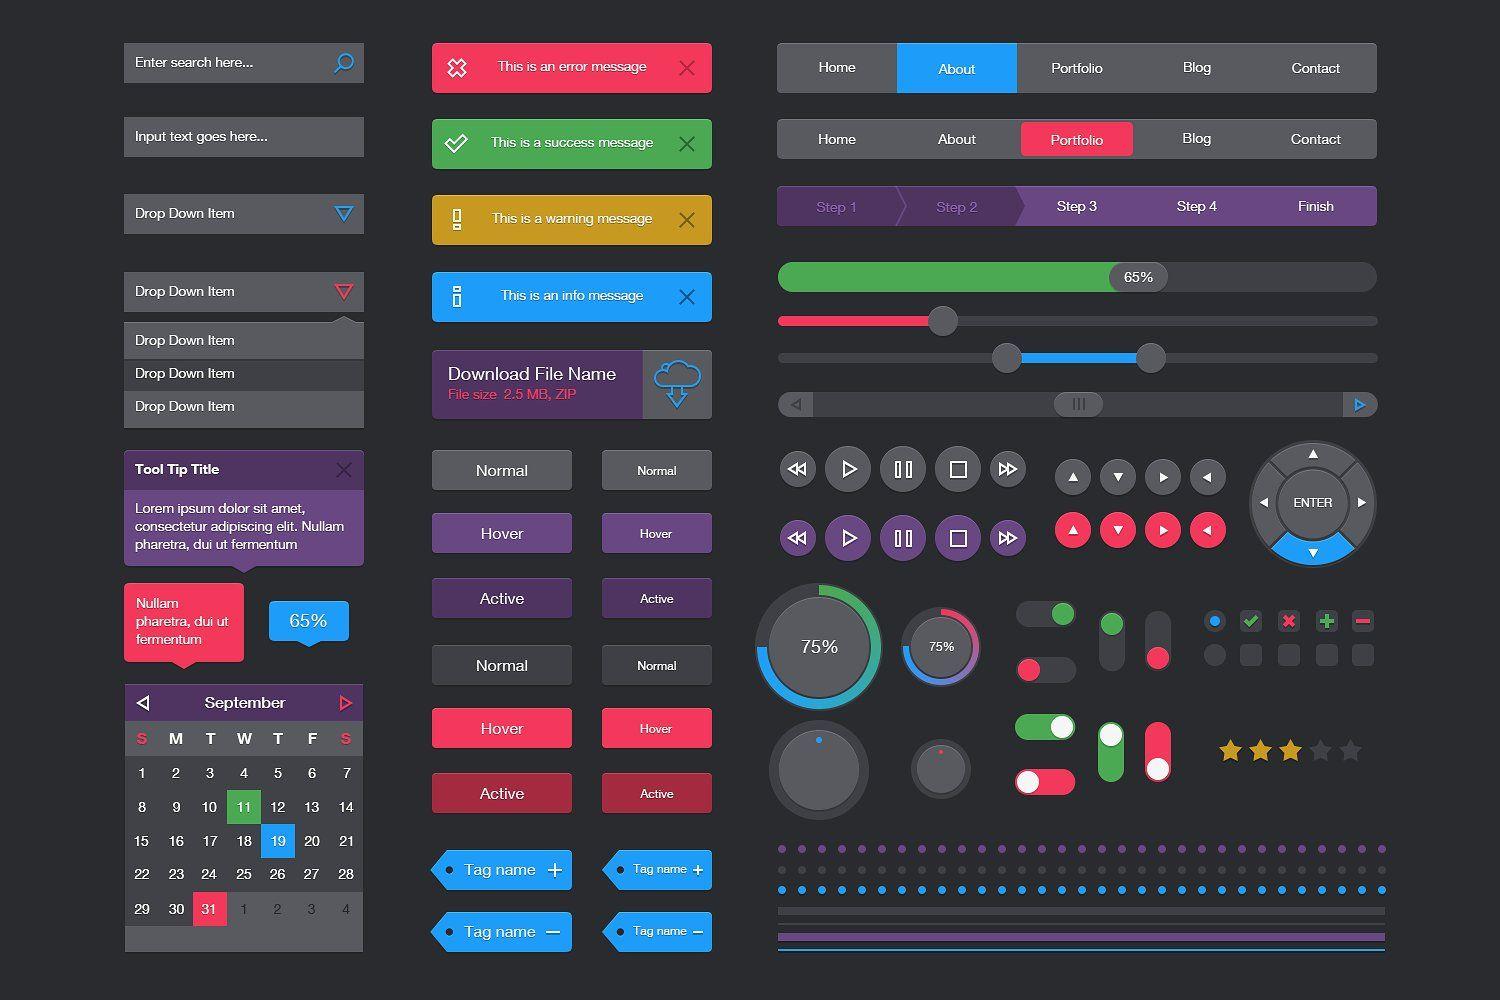
Syntrixilus specializes in crafting bespoke visual UI components that transform complex digital security data into intuitive, actionable insights. Our expertise lies in creating compelling, animated, and interactive interfaces designed to enhance awareness and understanding of system integrity and protective measures.
Dynamic Threat Intelligence Visualizations
We develop sophisticated animated elements that provide real-time, engaging representations of security states and potential vulnerabilities. These components are engineered to alert users effectively without overwhelming them, making critical information immediately comprehensible.
- Animated Security Status Indicators: Visually dynamic elements that reflect the current state of digital protection, from robust to compromised.
- Real-time Incident Flow Animations: Interactive sequences illustrating the progression and resolution of security events within a system.
- Proactive Vulnerability Scan Visualizers: Engaging animations that depict ongoing system health checks and highlight areas requiring attention.
Interactive Security Metaphors
Syntrixilus excels in designing unique interactive elements that serve as powerful visual metaphors for various security concepts. These components translate abstract data into tangible, understandable representations, fostering a deeper engagement with security protocols.
- Interactive Protective Layer Gauges: Dynamic visual candles or bars that intuitively show the strength and depth of system defenses against external threats.
- Data Integrity Flow Simulations: Animated visualizations demonstrating the secure transit and storage of sensitive information.
- User Authentication Journey Maps: Interactive components that illustrate the steps and security checks involved in accessing digital resources.
Comprehensive Digital Activity Mapping
Understanding system behavior is paramount for robust digital security. Our bespoke activity maps and visual state metaphors offer unparalleled clarity into user actions, system processes, and potential anomalies, providing a complete picture of operational security, a specialty of Syntrixilus.
- Audit Trail Activity Maps: Detailed, interactive visual representations of user and system actions over time, crucial for forensic analysis and compliance.
- Network Traffic Flow Visualizers: Animated maps illustrating data movement within and outside secure perimeters, highlighting unusual patterns.
- System Health Metaphor Dashboards: Intuitive visual representations that summarize the overall security posture and identify critical areas at a glance.
With Syntrixilus, organizations gain not just UI components, but a sophisticated visual language for digital security, empowering proactive defense and informed decision-making.


