At Syntrixilus, we specialize in transforming complex data into intuitive, engaging, and actionable visual experiences. Our expertise lies in crafting bespoke UI components that not only look exceptional but also serve as powerful tools for understanding underlying data patterns and states. We believe that clarity and interactivity are essential to unlocking the full potential of information.
Our comprehensive suite of services is built to elevate your data intelligence solutions, creating a seamless bridge between raw data and meaningful insights. We work closely with our clients to develop visual metaphors that resonate deeply with their operational contexts, ensuring that every element contributes to a richer and more cohesive understanding.
-
Dynamic Interface Components
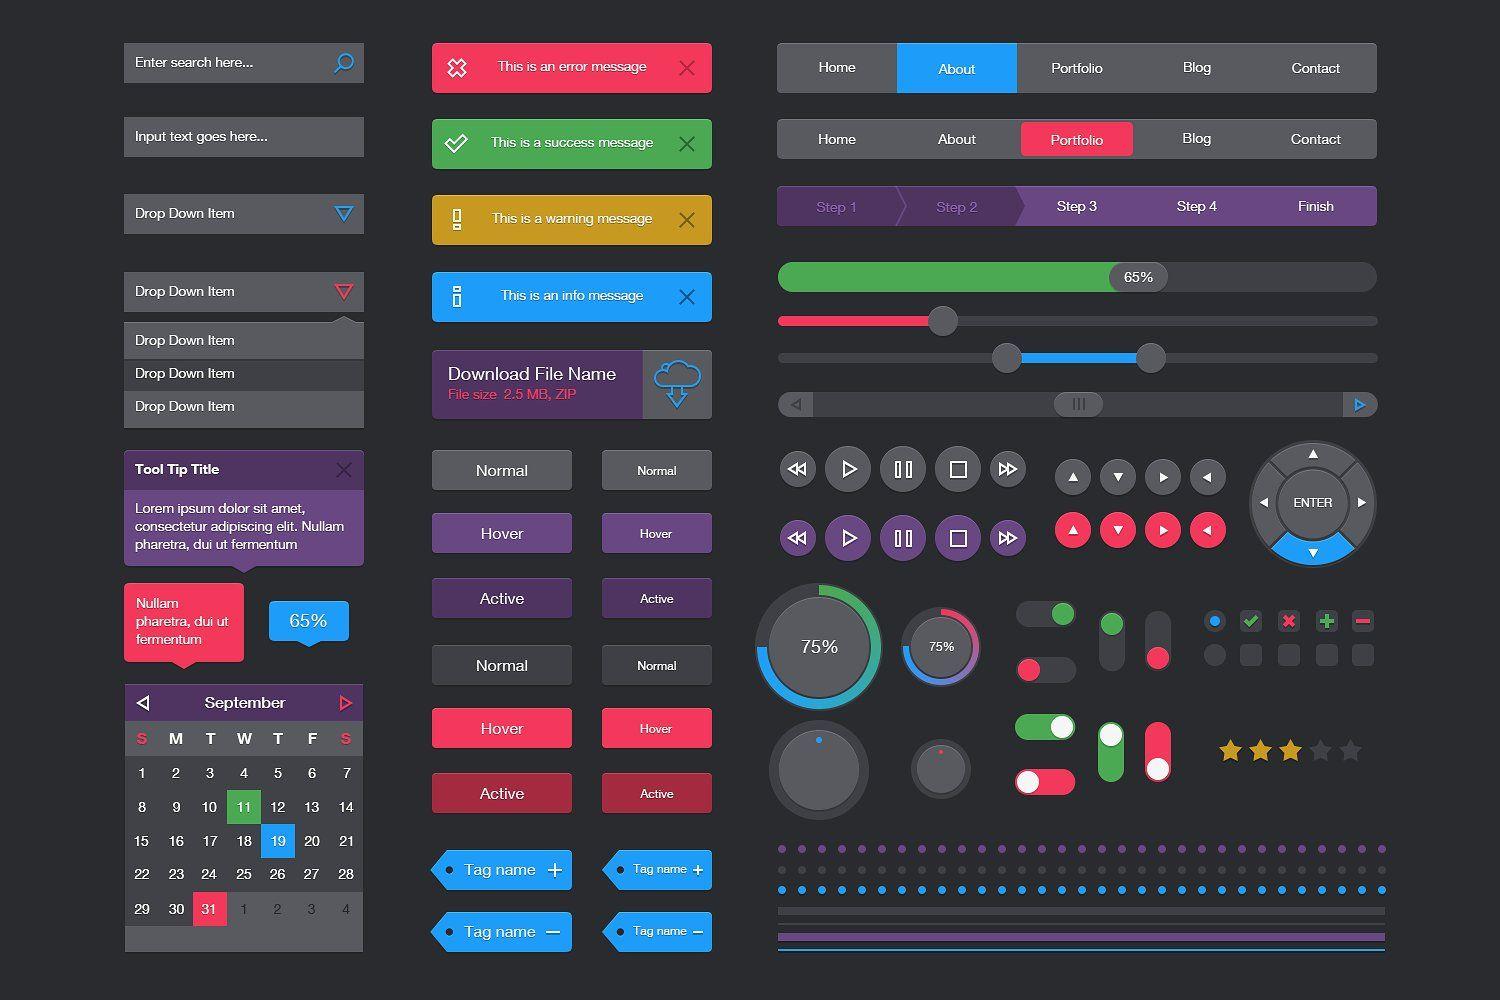
We engineer cutting-edge visual UI components tailored to your unique data presentation needs. From intricate dashboards to streamlined control panels, our designs prioritize clarity and user engagement, making data exploration an intuitive process.
-
Animated Data Storytelling
Our team creates captivating animated elements that bring your data to life. These motion graphics are meticulously designed to highlight critical shifts, illustrate processes, and guide users through complex information flows, fostering a deeper connection with the data narrative. Syntrixilus focuses on creating visuals that inform and inspire.
-
Temporal Data Flux Visuals
Experience interactive visualizations that represent dynamic data states over time. These sophisticated elements allow for granular examination of temporal trends and fluctuations, providing a clear, responsive view of evolving data points and their relationships.
-
Behavioral Activity Maps
Uncover patterns and interactions with our custom-designed activity maps. These visual tools offer a holistic perspective on user engagement, system performance, or process flow, revealing key areas of interaction and potential optimization opportunities. They provide a clear visual representation of complex activities.
-
Abstract State Metaphors
We develop innovative visual metaphors that succinctly represent various system or data states. These abstract yet intuitive icons and indicators provide immediate comprehension of conditions, status, and alerts, enhancing situational awareness across your platforms. Our approach ensures meaningful and immediate understanding of critical information.
Syntrixilus is dedicated to delivering visual solutions that not only meet but exceed expectations, turning your data into a compelling, interactive story.


